
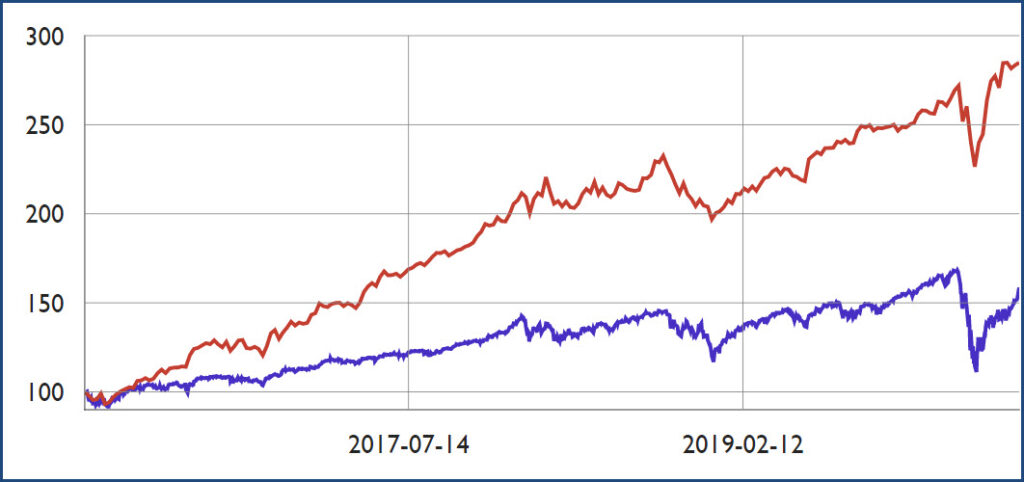
I could tell you, but then I´d have to kill you! This line from” The Hounds of Baskervilles” featuring Sherlock Holmes is quite relevant in this blog about AI and portfolios. You will understand why when you take a look at the following graph which looks at DynamicUSA vs SP-500 Performance.
Major points
-Volatility is lower than the SP-500 index
-Return is higher
This combination is normally quite hard to achieve consistently but our portfolio “Dynamic USA” beats the SP-500 quite comfortably. In short you are getting a higher return while taking a lower risk, so DynamicUSA vs SP-500 Performance is quite interesting
In SoftCapital we started to look at AI back in 2001 and did small projects to understand the technology behind this exiting area of computing, but not until 2016 did we start using this technology seriously in a new product meant for fund composition and rebalancing. The major difference from 2001 till 2016, is the tremendous computer power we have at our disposal in the cloud. Without major investments we have access to 100.000´s of computer processors/GPU´s that each can crunch their part of the calculations and bring them back to the mothership. Calculations that used to take weeks are now done in a matter of minutes.
During our research we found that AI (Neural network) could be applied in 2 majors areas in traditional –portfolio theory:
Portfolio/fund composition
Rebalancing of same
Markowitz?
We have not not based our proprietary solution on traditional mean variance or Markowitz approach, but we acknowledge that there is a tight non-linear relationship between expected return and risk – and we have incorporated some of these approaches into our AI based solution.
A portfolio is only optimal in its composition until the next market price changes, and a rebalance of weights is necessary. The normal approach in a fund or institutional portfolio is to apply metods of 1. Drifting or 2. Timed rebalancing.
A 3:rd method exists, Dynamic rebalancing. In Dynamic rebalancing you rebalance when it it necessary. In short “When the costs of being suboptimal exceeds the return of being optimal, a rebalance should be performed taking the transaction costs into account. The challenge here is that Risk is not a monetary term and has to be converted so a direct comparison is possible – We think we have solved this challenge in an intelligent way.
The combination of those 2 approaches has proven to be very stabile and rewarding in the 20 something portfolios in various compositions as sectors and regions we are running.
We are traditionally a software house and the original idea was to offer the compositions of portfolios and following rebalancing to retail clients for a reasonable fee but regulations in both EU and the US makes this approach quite difficult and expensive, so an institutional approach in form of a hosted fund-management solution to institutional is probably the approach we will take.
We still have a lot of testing and due diligence to perform and in the meantime DynamicUSA and other test portfolios is traded at Interactive brokers to gather history (The proof is In the pudding.)
DynamicUSA vs SP-500 Performance is quite remarkable
Many people has asked us to share the code of this, we can – but refer to the beginning of the article.
Looking Forward, DynamicUSA vs SP-500 Performance
As we move forward, the lessons learned from this period will continue to inform investment strategies. The ability to adapt to rapid changes in the market, a keen eye for emerging technologies, and a robust risk management framework are more crucial than ever. Investors and fund managers alike must remain vigilant and agile, ready to respond to the ever-evolving financial landscape.
In conclusion, while the performance figures of DynamicUSA vs SP-500 Performance from 2016 to 2020 provide a clear picture of past successes, understanding the strategies and market dynamics behind these numbers is essential for future investment planning. As the financial world continues to evolve, these insights will be invaluable in navigating the markets of tomorrow.”
Graph:
Period: Jan.1-2016 – Jun.1 2020
Start value SP-500: 100 end value: 155
Start value DynamicUSA: 100 end value: 284.85
JUN
2020